A box plot, also called a box and whisker plot is a simply but very useful way to visualise the distribution of a list of values – are they spread out or bunched up, and where in their range are the bunched up?
Box plots are not a standard chart type in Excel – a glaring omission. There are many guides online about how to make a box plot in Excel, but I couldn't find a macro to do it – so I wrote one.
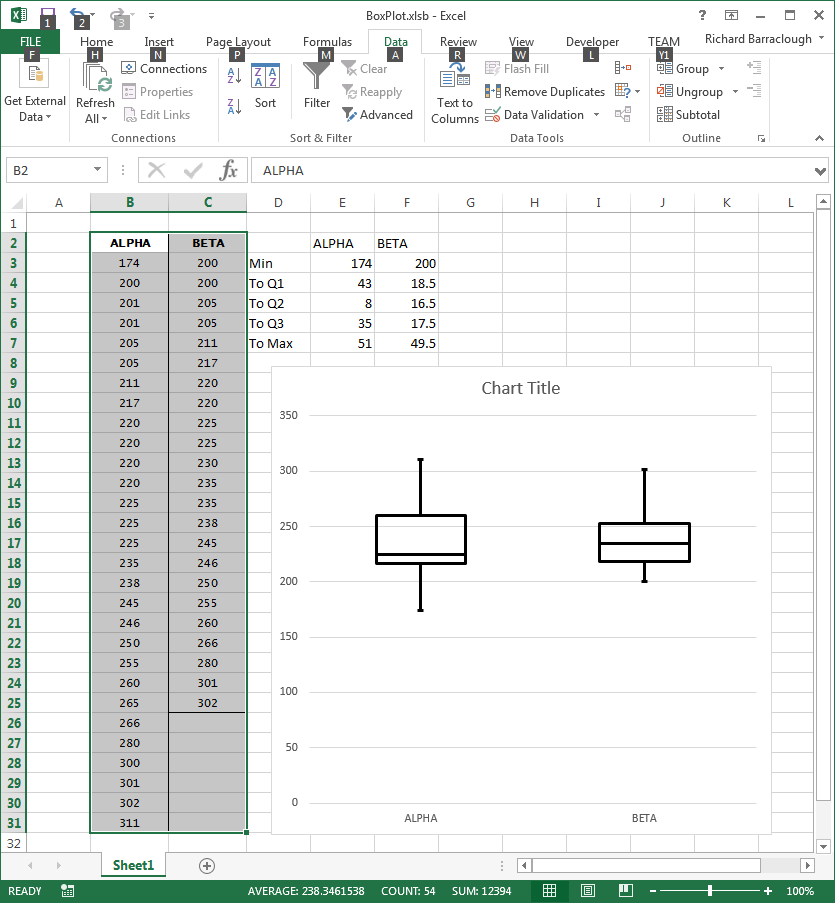
To use the macro: arrange your data series into columns with the series name in the top row. Select the columns and run the macro. The columns to the right of the selection are used for calculating the values to be plotted.
And here's the macro. If it's useful and you're feeling a bit flush then why not send me a quid?
Sub MakeBoxPlotsFromSelection()
    '
    ' MakeBoxPlotsFromSelection
    ' Copyright 2015 Richard Barraclough
    '
    ' To use:
    ' Your data series are in (contiguous) columns
    '   and the first row contains the series names.
    ' Select your data, including the series names.
    ' The columns to the right of the selection are used to calculate values to plot.
    ' There is one more calculation column than you have data series.

    Dim ra As Integer ' first row of range
    Dim rz As Integer ' last row of range
    Dim ca As Integer ' first column of range
    Dim cz As Integer ' last column of range
    Dim s As String ' where we're putting our calculation cells

    ra = Selection.Cells(1, 1).Row
    rz = Selection.Cells(Selection.Rows.Count, 1).Row
    ca = Selection.Cells(1, 1).Column
    cz = Selection.Cells(1, Selection.Columns.Count).Column

    Cells(ra + 1, cz + 1).Value = "Min"
    Cells(ra + 2, cz + 1).Value = "To Q1"
    Cells(ra + 3, cz + 1).Value = "To Q2"
    Cells(ra + 4, cz + 1).Value = "To Q3"
    Cells(ra + 5, cz + 1).Value = "To Max"
    For n = 0 To cz - ca
        r = "R" & ra & "C" & ca + n & ":R" & rz & "C" & ca + n
        Cells(ra + 0, cz + 2 + n).Formula = "=" & r
        Cells(ra + 1, cz + 2 + n).Formula = "=MIN(" & r & ")"
        Cells(ra + 2, cz + 2 + n).Formula = "=QUARTILE(" & r & ", 1) - MIN(" & r & ")"
        Cells(ra + 3, cz + 2 + n).Formula = "=QUARTILE(" & r & ", 2) - QUARTILE(" & r & ", 1)"
        Cells(ra + 4, cz + 2 + n).Formula = "=QUARTILE(" & r & ", 3) - QUARTILE(" & r & ", 2)"
        Cells(ra + 5, cz + 2 + n).Formula = "=MAX(" & r & ") - QUARTILE(" & r & ", 3)"
    Next n

    Range(Cells(ra, cz + 1).Address, Cells(ra + 4, cz + 1 + cz - ca + 1).Address).Select
    ActiveSheet.Shapes.AddChart2(297, xlColumnStacked).Select
    ActiveChart.PlotBy = xlColumns
    ActiveChart.PlotBy = xlRows
    ActiveChart.SeriesCollection("Min").Format.Fill.Visible = msoFalse
    ActiveChart.SeriesCollection("Min").Format.Line.Visible = msoFalse
    ActiveChart.SeriesCollection("To Q1").Format.Fill.Visible = msoFalse
    ActiveChart.SeriesCollection("To Q1").Format.Line.Visible = msoFalse
    ActiveChart.SeriesCollection("To Q2").Format.Fill.Visible = msoFalse
    ActiveChart.SeriesCollection("To Q2").Select
    With Selection.Format.Line
        .Visible = msoTrue
        .ForeColor.ObjectThemeColor = msoThemeColorText1
        .ForeColor.TintAndShade = 0
        .ForeColor.Brightness = 0
        .Weight = 2
    End With
    ActiveChart.SeriesCollection("To Q3").Format.Fill.Visible = msoFalse
    ActiveChart.SeriesCollection("To Q3").Select
    With Selection.Format.Line
        .Visible = msoTrue
        .ForeColor.ObjectThemeColor = msoThemeColorText1
        .ForeColor.TintAndShade = 0
        .ForeColor.Brightness = 0
        .Weight = 2
    End With

    s = Cells(ra + 2, cz + 2).Address & ":" & Cells(ra + 2, cz + 1 + cz - ca + 1).Address

    ActiveChart.SeriesCollection("To Q1").HasErrorBars = True
    ActiveChart.SeriesCollection("To Q1").ErrorBar _
        Direction:=xlY, Include:=xlErrorBarIncludeMinusValues, Type:=xlErrorBarTypeCustom, Amount:=Range(s), MinusValues:=Range(s)

    ActiveChart.SeriesCollection("To Q1").ErrorBars.Select
    With Selection.Format.Line
        .Visible = msoTrue
        .ForeColor.ObjectThemeColor = msoThemeColorText1
        .ForeColor.TintAndShade = 0
        .ForeColor.Brightness = 0
        .Weight = 2
    End With

    s = Cells(ra + 5, cz + 2).Address & ":" & Cells(ra + 5, cz + 1 + cz - ca + 1).Address
    ActiveChart.SeriesCollection("To Q3").HasErrorBars = True
    ActiveChart.SeriesCollection("To Q3").ErrorBar _
        Direction:=xlY, Include:=xlErrorBarIncludePlusValues, Type:=xlErrorBarTypeCustom, Amount:=Range(s)

    ActiveChart.SeriesCollection("To Q3").ErrorBars.Select
    With Selection.Format.Line
        .Visible = msoTrue
        .ForeColor.ObjectThemeColor = msoThemeColorText1
        .ForeColor.TintAndShade = 0
        .ForeColor.Brightness = 0
        .Weight = 2
    End With
End Sub